The chart of accounts is a list of all the accounts used in the general ledger of your company.
It creates the roadmap of your financial transactions.
Getting this right (first time) will really help you know your numbers.
You chart of accounts will include;
Balance sheet accounts
|
Profit and loss accounts
|
The key to getting your chart of accounts right is to understand what you need to measure in order to manage your business effectively.
It is a common mistake to try keep your chart of accounts as lean as possible and use generic account codes for multiple costs. If you want to manage your business effectively then you need to have enough detail in your chart of accounts to see exactly where your income is coming from and where your money is being spent.
In this case less is most definitely not more.
Top tips
Try to follow these top tips for a really effective chart of accounts:
- Be Consistent– if you have more than one company try to produce a chart of accounts which will be consistent across each of your businesses
- Future proof – try to create a chart of accounts that is unlikely to change much in future years
- Maintain regularly – review your chart of accounts regularly and streamline where appropriate
Here are a few examples of different levels of analysis for different purposes in the chart of accounts:
Income by revenue stream
In this example, the company is selling 3 different products; Bits and bobs, Thing-a-me-bobs and Widgets. The business wants to know the value of sales of each product each month.
The sales codes are defined in the chart of accounts using a unique Revenue account for each product item.
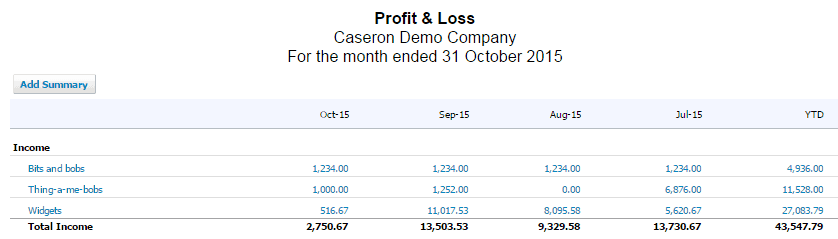
When this may apply:
- When you have regular demand for products or services
- When you are tracking performance of each sale type
Income by geographic area
In this example, the company may be selling one type of product but wants to know how much is sold by geographic region.
The sales codes are defined in the chart of accounts using a unique Revenue account for each region
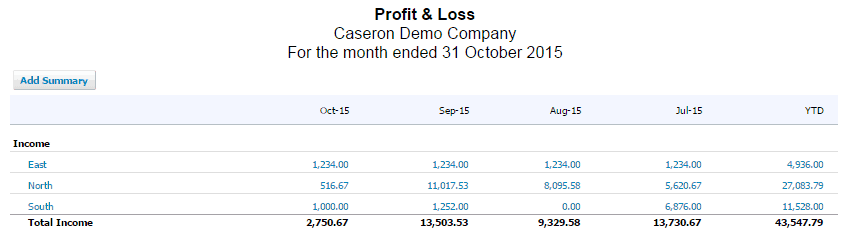
When this may apply:
- When you have multiple divisions in your business
- When you have resellers or regionally based sales teams
Income by revenue stream and by geographic area
Here the company wants to measure against both revenues stream and geographic area.
In Xero this is achieved by defining the product codes in the chart of account and by using project or tracking codes to ‘cut’ that data vertically as well as horizontally creating a ‘silo’ effect for reporting. In this example we are also using the unassigned column to track any income (or expense) that is not allocated to a region.
The sales codes are defined in the chart of accounts using a unique Revenue account for each product item.
The geographic areas are set up as tracking codes which are applied to any relevant sales invoices.
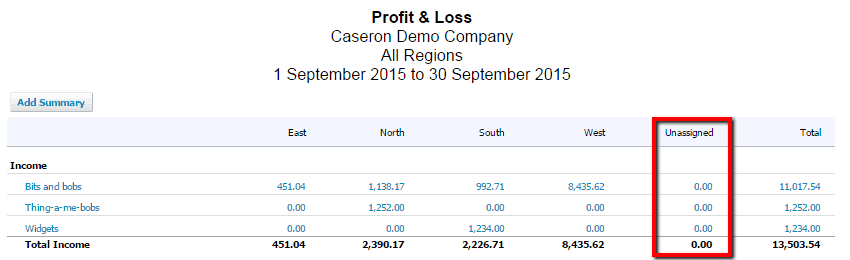
When this may apply:
- When you have regular demand for products or services
- When you are tracking performance of each sale type
- When you have multiple divisions in your business
- When you have resellers or regionally based sales teams
An unstructured report
Unstructured reports, sorted in alphabetical order are typical of most accounting systems.
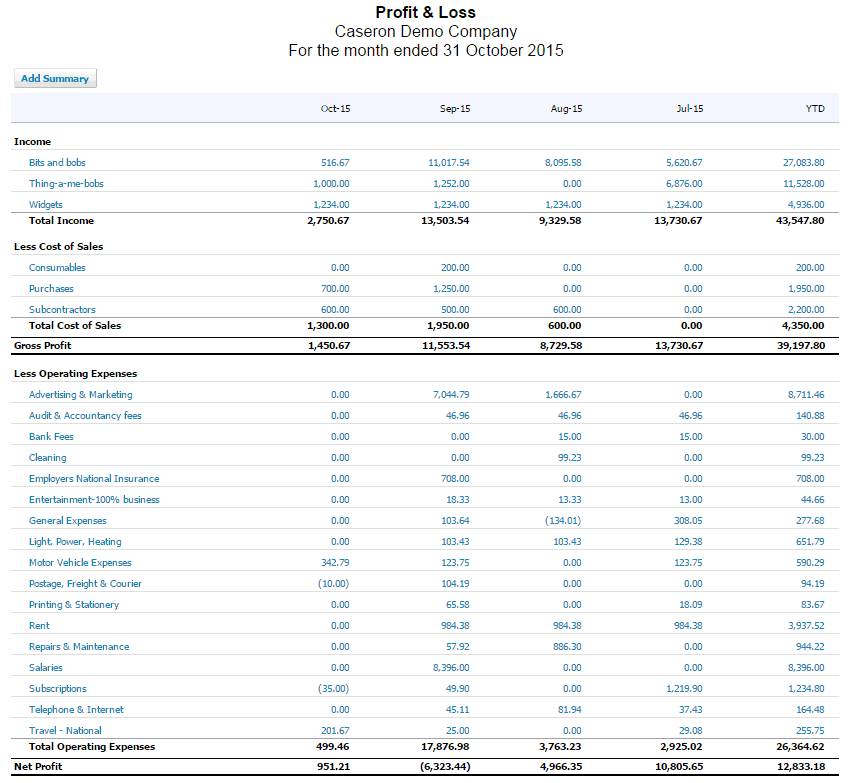
Although this report does provide the basics, you could potentially gain more insight to how your business is performing by re-structuring your report.
For example: some line items may be directly affected by a change in another, such as Employer’s NI and Salaries, or more importantly; Sales of Widgets and Costs of Consumables. When these are left without a structure it becomes more difficult to see if these trends stay consistent.
Detailed reports for management accounting
You may wish to see a detailed functional Profit and Loss account when reviewing your management accounts. Creating functional groups for Premises Costs and Office Expenses (for example) allows you to measure the individual line items and the total cost of that function by month, quarter or year or against budget and forecast.
If it can be measured, it can be managed.
Costs would be much harder to control if they were accounted for at a functional level. When you track items at a more granular level – you can quickly pick up anomalies, missing costs, overspends and trends.
The cost codes are defined in the chart of accounts using a unique Overhead / Expenses account for each service / product type.
These are then grouped under sub headings within the report layout in the accounts.
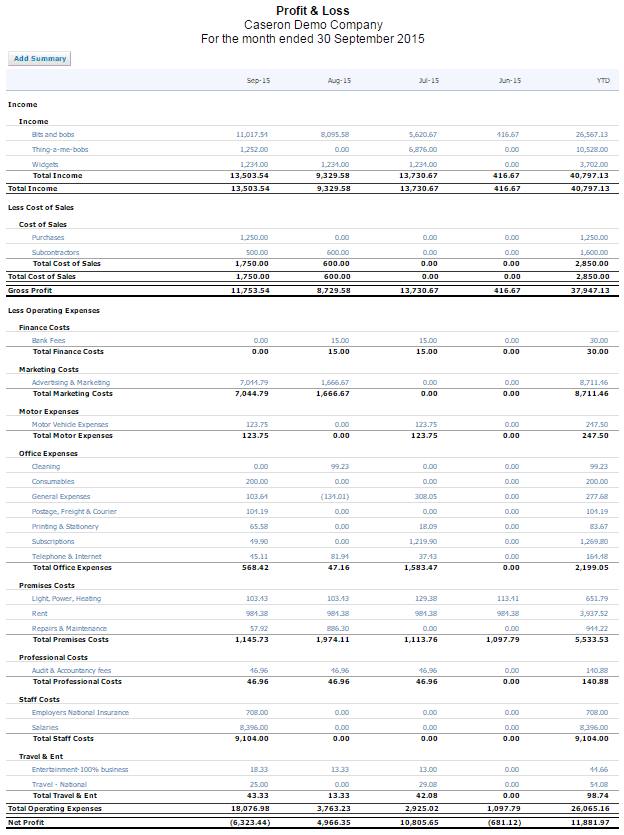
With this format we can more easily spot areas which fluctuate and need to be brought to attention – this makes it easier to drill down in to what the issues are. What you often find is that accounts which are grouped together often fluctuate in relation to one another. Say you move to a new property you Rent, Rates and Energy consumption may all change.
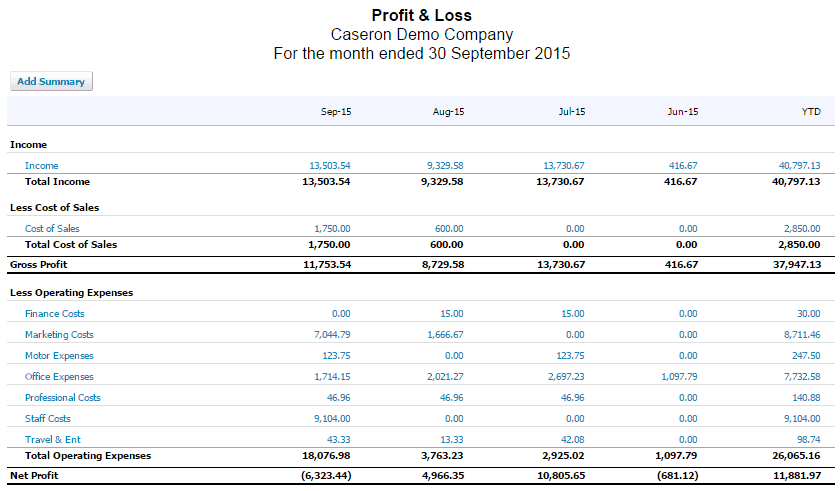
Summary Reports for Management and The Board
Even though you may generate detailed reports for your month end reviews – you may wish to provide investors, banks, or members of the Board a much more concise picture of your accounts.
You can always group accounts under sub-headings to show a more consolidated report, it is much harder to take grouped data and break it back down again if you have used generic accounts to account for costs of more than one type.
So we recommend you build the detailed reports first, followed by the more consolidated ones.
When this may apply:
- When your usual reports create a large volume of data
- When you have potential investors who ask to see the accounts
- When you are applying for loans which require a copy of the accounts
The same principles can be applied to the balance sheet.
Liability Tracking
Separating accounts in the balance sheet and grouping them under sub-headings can also be very useful.
For example you may be a CIS contractor needing to track CIS liabilities.
Sometimes this can become confusing to track if you use a single CIS liability. Maybe it’s worth making an account for CIS Deducted, Suffered and Paid?
The net effect of these 3 codes will be the amount of CIS which is still due to HMRC.
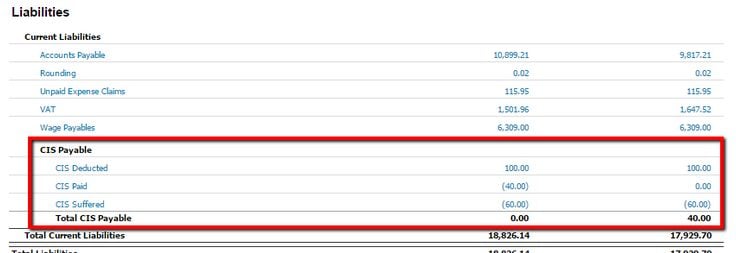
Grouping accounts so you can see the total outcome as well as each section which makes up the balance is a fantastic way to keep in control and it makes it much simpler to check for any errors or differences.
This principle can also be applied to other liabilities.
Directors’ Loan Accounts
You may have several directors and you wish to track their individual directors’ loan account balances (this could be partners and their current accounts if this were not a limited company).
In this example one director has a negative liability – i.e. an asset balance. This means that the director has drawn money from the company. Until it is repaid to the company or paid off with a dividend it remains a company asset with the potential to be reclaimed.
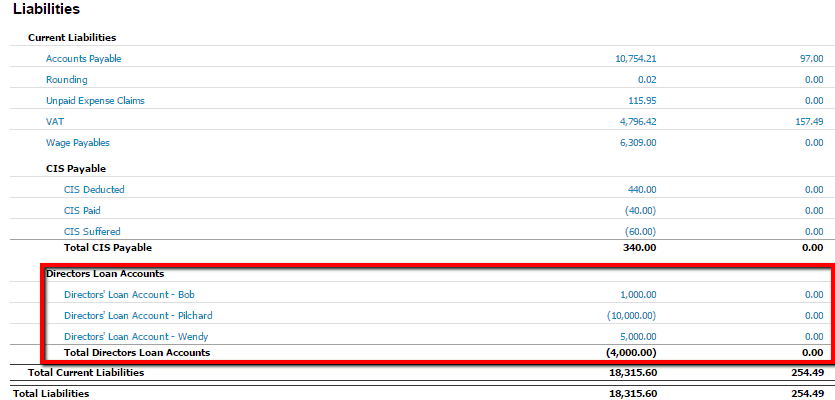
From sectioning these out we become more able to pro-actively prepare as a financial year end (or tax year) closes.
And finally – taxes
Avoid fines by recording your liabilities correctly in your accounts and paying your tax liabilities on time.
Although HMRC’s online account has updated to Real Time Information it is very common for a timing difference between their records and a business’s records.

If you can identify exactly what your liability should be you can more easily check any discrepancies and also monitor your liability as it grows.
This is particularly useful for VAT and PAYE (on a weekly payroll especially) where your liability builds up in small amounts over time before it becomes due for payment. With this you are in a stronger position to prepare and set aside any funds.
What is important to you in your business?
Take a few moments to consider what is important in your business, what needs to be managed or controlled. The devil truly is in the detail.
0 Comments